Investment Basics Part II: Risk and Reward
Fear and greed are two of the most common emotions when it comes to investing. Unfortunately, fear is often driven by a lack of information and knowledge. We tend to fear things we don’t understand and it doesn’t help when we hear horror stories of people losing money in bad investments. Perhaps we even tried investing one time and got into something we didn’t fully understand only to see our account balance go down, at which time, we pulled our money out and have been scared to invest since. Greed, on the other hand, motivates us to take action and often overlook the information and knowledge that we have. Perhaps a co-worker or relative told us of a great investment that will make everyone a lot of money. The desire to get rich can override our good judgement and lead us to ignore the potential warning signs.
Those two examples should reinforce the need for wisdom when it comes to investing. Both individuals are making irrational decisions driven by emotion and in most cases their choices will cost them in the end. We always need to understand the risks and rewards associated with any investments we are considering. Without a full understanding, we’re likely to make an emotional decision that causes us to either earn less than we should or take too much risk in the pursuit of greater returns, which could ultimately cause us to lose some, or all, of what we have saved.
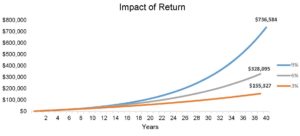
The following chart demonstrates why earning a higher return matters. The chart shows the results of a person contributing $2,000 per year into three different accounts earning a 3%, 6% or 9% average return (all hypothetical) over a 40 year period. The difference in the ending balance is staggering and may be the difference between being able to provide for your family in retirement or not.
While it’s important to strive for higher returns, let’s not overlook the importance of avoiding losses. If a person makes four equal investments and earns 10% on the first three investments, but loses 50% on the fourth one, the return of the four investments combined is a loss of 5%. This again stresses the importance of wisdom and understanding risks when it comes to investing.
What is Risk
There are a lot of different types of investment risks in the investment world and I don’t plan to get that deep into the details. However, many of those risks can be reduced or removed through diversification. Diversification is simply the process of allocating your investments into enough places to reduce individual circumstance risk to the point that it is no longer a major issue. For example, to a homeowner whose home was destroyed by fire, it is a devastating financial loss. However, to the insurance company that insures a million homes, the financial impact of one home burning to the ground is barely a blip on the radar.
Diversification is one of the investment lessons we can learn directly from scripture. Ecclesiastes 11:2 tells us to “Invest in seven ventures, yes, in eight; you do not know what disaster may come upon the land” (NIV). It’s the old saying “don’t put all your eggs in one basket”.
For the remainder of this article, I’m going to assume that individuals are diversified enough to reduce the risks associated with a single investment. When diversified, what most individuals would consider risk could be better defined as volatility. Volatility is the range of returns that an investor will experience. The greater the volatility of an investment, the greater the range of returns an investor can expect to experience from one time period to the next.
Risk / Return Relationship
The relationship between risk and return is one of the fundamental principles of investing. The basic understanding is that as an investor takes on more risk, there will be a greater expected return. In the absence of a higher expected return, a rational investor will always choose the investment with less risk since it would earn the same return. There may be anomalies from time to time, but in the end, this relationship should prove out.
To understand the concept, we can start by considering what some people would call a risk-free investment. That could be a bank CD (insured by FDIC) or Treasury Bills (insured by the government). Either of those investments are often considered risk-free since the risk of not getting your money back in the end is very small. Anything that has more risk than these risk-free investments will need to pay you what is referred to as a risk premium in order to entice you to invest in them. If taking more risk didn’t come with the expectation of a higher return, there would be no reason to increase risk.
The following graph illustrates the risk/return relationship between stocks and bonds. Stocks are traditionally represented by the S&P 500 and bonds in this chart are represented by the Merrill Lynch 7-10 year US Treasury Index.
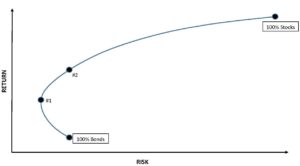
This chart depicts what is known as the Efficient Frontier. The curved line represents the long-term expected risk and return for both of these assets. The higher a point is on the graph, the higher the expected return and the more a point moves to the right, the greater the risk (measured as volatility).
The general trend we can observe is that return increases as we take on more risk, which is why we see stocks higher and to the right of bonds. That being said, this chart does provide us with an interesting lesson that’s worth pointing out. Notice how a 100% investment in bonds (the more conservative of the two investments) is not the lowest risk point on the chart? As small amounts of stock are added to the investment mix, risk is decreased while returns are increased. Point #1 is actually the lowest risk point on the line. That lowest risk point is commonly represented by a mixture somewhere around 25% stocks and 75% bonds, but will vary depending on conditions. It seems counter-intuitive that adding an asset with higher risk would decrease the total risk in the account, but that’s the benefit of diversification. It not only decreases risk, but also increases to potential return.
The above chart provides another good incentive for understanding risk and return. The uninformed investor trying to avoid risk might be tempted to invest everything in the most conservative asset. However, the informed investor understands they can take less risk and get a higher return by moving to Point #1 or they can keep risk the same and get an even higher expected return by moving straight up the chart to the allocation mix found at Point #2. Either decision would be more efficient than investing 100% in bonds.
Note: The Efficient Frontier chart assumes an efficient market where everything runs perfectly. In reality, that doesn’t happen, so there will be instances when these relationships don’t hold true, but over time, they tend to prove out.
Matching Risk with Goals
Good analysts can statistically predict future risks and long-term expected returns with a fair amount of accuracy. Armed with that information, an investor is able to match their risk tolerance and investment time frame with an appropriate investment.
Remember, the biggest concern for a diversified investor tends to be volatility and the chance that investment returns for a given time frame will not match up with what was expected. For example, if we’re saving to purchase a new car in two years, it wouldn’t make sense to invest in something that has a reasonable chance of incurring a loss over a two year period. To do so would be little more than gambling since we’re just hoping to hit a few good years while avoiding the bad ones. However, the person saving for retirement in 20 years might consider that same thing an appropriate investment since they have more time for the ups and downs to average out. They’re less concerned about the next two years and know that by taking on that additional volatility risk, they will likely be rewarded with a higher return in the end.
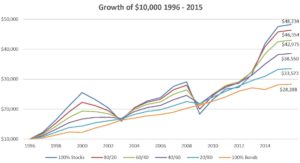
To make this all a little more real, let’s look at a chart that represents actual returns of different allocation mixtures of stocks and bonds from the 20-year period of 1996-2015. All lines start with an investment of $10,000 made in 1996 and chart the value at the end of each year based on actual investment returns (as determined by Morningstar) of the S&P 500 Index (stocks) and the Bloomberg Barclays US Aggregate Bond TR Index (bonds). The different lines represent 20% allocation changes from stocks to bonds. I like this chart because it shows the up and down volatility that an actual investor would’ve experienced over that time period as well as the eventual payoff for accepting that volatility along the way. This is a particularly interesting 20-year period because there were two significant stock market corrections during this time. The chart illustrates how not properly matching up risk and time horizon could certainly hurt an investor. However, over a long enough time, we see what we would expect, which is risk being rewarded with additional return.
Conclusion
Investing is a part of our stewardship responsibility. If we find ourselves in a situation where we have savings, we need to try to make the most of those resources by earning a reasonable return on them and not taking unnecessary or unrewarded risk.
The other thing to remember is that we are simply stewards and God is the ultimate owner of every asset we have. We should try to minimize the fear of the unknown by getting educated and at the same time avoid making foolish decisions driven by greed and a desire to get rich. Proverbs 9:10 says, “The fear of the Lord is the beginning of wisdom.” We should fear God and not the things of this world. Our job as investors and ultimately as stewards is to make the best decisions we can and trust the results to God. He is sovereign over all things, including our portfolios.
Brad Graber, CFP® has been working with clients on personal financial planning and investment issues since 1996. He invests his time mentoring and educating individuals on ways to be better stewards of the resources God has entrusted to them.
***Disclaimer: The information contained in this article is general in nature, is provided for informational purposes only, and should not be construed as investment advice. I cannot guarantee that all information is accurate, complete, or timely. Any performance related material is for information purposes only. Past performance is no indication of future results and should not be used for making investment decisions. Performance data was provided by Morningstar. The information in this article should not be construed as investment advice or a recommendation of any particular investment. Please seek out professional investment advice before investing.
Investing as a part of stewardship is again overlooked in my opinion. Less education = more fear as pointed out in the first paragraph. One of my college professors told us the stock market has averaged 10-12% ROI but you can’t overlook inflation and shouldn’t count on a “published average” in your financial planning. Investing in companies is always going to be a rollercoaster but the leading companies should be worth more in the future than they are today. So if you experience a fast downward spiral like in 2008, just stay on the rollercoaster until it’s your time to get off and everything should be okay.